
Today’s Dietitian
Vol. 27 No. 7 P. 36
Take this course and earn 2 CEUs on our Continuing Education Learning Library
Food insecurity (FI) is a critical public health challenge in the United States that impacts the nutrition and health of millions of families and individuals, including older adults. There have been significant increases in the number of Americans facing FI in recent years, with 12.8% of US households reporting FI in 2022.1 Households with older adults (aged 65 and over) had a lower overall FI rate of 9.1%, but this rate was elevated to 11.4% in older adults living alone.1 Predicted increases and demographic changes in the older adult population indicate that FI in older adults is a growing problem. Moreover, the physiological, health, and social changes associated with aging can heighten older adults’ susceptibility to the negative nutrition and health effects of FI.
This continuing education course examines the risk factors for and health effects of FI in older adults, highlights available food assistance programs and their impact, and provides nutrition professionals with strategies to improve older adults’ food security.
Measuring Food Security
Food security means having “access to enough food for active, healthy living” and FI occurs when this access is “limited by a lack of money and other resources,” according to the USDA.2 FI in older adults has been associated with lower diet quality and poorer physical and mental health. Identifying FI in older adults is essential to addressing this challenge. The following are common measures used to assess food security:
The US Household Food Security Survey Module (HFSSM), conducted annually by the US Census Bureau for the USDA, classifies participating households as having high food security, marginal food security, low food security, or very low food security, based on their responses to a series of questions about being able to afford adequate food during the previous year.3 Households experiencing FI report concerns about running out of food or having enough for balanced meals.2 Most of those facing very low food security, 5.1% of US households in 2022, report reducing their food intake or skipping meals at some point during the year.1,2
The Hunger Vital Sign, a screening tool often used in clinical, public health, and research settings, is validated for clinical use in older adults and has demonstrated high sensitivity and specificity for use in households with older adults.4,5 Health care providers frequently screen individuals or families with the measure’s two questions: “Within the past 12 months we worried whether our food would run out before we got money to buy more” and “Within the past 12 months the food we bought just didn’t last and we didn’t have money to get more,” with a response of “often or sometimes true” indicating potential FI.6,7
Some researchers have proposed improving the accuracy of FI screening in older adults with additional, targeted questions that address common nonfinancial barriers to food security in this population, including social support and mobility concerns and difficulty accessing foods appropriate for chronic health conditions.2,8-10
Food-Insecure Older Americans: A Growing Population
Projected increases in the number of older Americans—along with growing racial and ethnic diversity—will likely result in many more older adults at risk for FI.11 In 2020, older adults (aged 65 and over) made up 17% of the population, and this number is projected to increase to 22% by 2040, with the number of those 85 and over nearly doubling by 2035.12-14 Multiple, often intersecting, factors impact the risk of FI in this growing population:
Demographics
Younger age groups among older adults have consistently higher rates of FI than do the older age groups; adults aged 60 to 69 had almost twice the rate of very low food security as did those aged 80 and over in 2021.15 However, there were significant increases in the FI rates of adults 80 and over from 2020 to 2021.15
Race and ethnicity are strongly linked with FI risk; the FI rate for Black older adults is more than three times that of white older adults, and FI rates among Hispanic older adults are approximately twice those of non-Hispanic older adults.15 These numbers reflect the economic and social disparities that disproportionally impact minority populations.16,17 Racial and ethnic minorities represented 24% of the older adult population in 2020 and this number is projected to increase to 34% of the older adult population by 2040.12
Socially isolated older adults have a higher risk of FI. In 2021, about 27% of older adults lived alone, including 21% of older men and 33% of older women, and this percentage was higher in the older age groups, with 43% of women aged 75 and over living alone.12 Rates of FI are significantly higher for older adults without a partner; widowed older adults have twice the FI rate of those who are married, while older adults who have divorced, separated, or never married have over three times the FI rate of those who are married.8,15
Households with older adults responsible for minors, however, have a higher risk of FI. In 2020, about 1.1 million grandparents aged 60 and over were caring for one or more grandchildren under age 18 who lived with them, and these households were more than twice as likely to experience FI as households without grandchildren.12,15
Although the majority of older adults with FI live in metro areas, nonmetro areas had higher overall rates of older adult FI than did metro areas.15 The southern states tend to have the highest rates of FI in older adults.15 Lower levels of educational attainment have also been linked with FI in older adults.18,19
Socioeconomics
About five million older adults (9%) had incomes below the Federal Poverty Level (FPL) in 2020, with an additional 2.6 million (4.6%) considered “near poor” with an income under 125% of the FPL.12 FI rates are substantially higher for older adults with incomes less than twice the FPL and are highest for those with incomes below the FPL. In 2021, more than one-quarter of older adults with incomes below the FPL were food insecure and over 10% of them had very low food security.15 Factors associated with higher rates of poverty included being part of a racial or ethnic minority group, being female, and living alone.12 Poverty rose dramatically in 2022, up to 12.4% of the US population, according to the Supplemental Poverty Measure—which uses broader guidelines for family composition and necessary expenses—mainly due to changes in federal pandemic-era stimulus payments.20 Using this measure, poverty rates for older adults were even higher, at 14.1% overall, over 20% for Black, Native American, and Alaskan Native older adults, and over 24% for Hispanic older adults.20-22
Competing financial demands, such as housing, utilities, and transportation, can impact the food security of older adults.16,23,24 Older adults who rent have over three times the FI rate of those who own their homes.15 Older adults without a permanent residence have about five times the rate of FI of the general older adult population, and about one-third of them have very low food security, according to a study of adults aged 50 and over experiencing homelessness in Oakland, California.25 During the COVID-19 pandemic, adults aged 50 and over who lost their homeowner status were nearly three times more likely to have FI.26
Since the onset of the pandemic, social isolation, supply chain issues, and inflation have presented additional threats to older adults’ food security.26 Early in the pandemic, measures of food insufficiency in older adults increased by 75%, with almost half of low-income older adults reporting reduced food variety.27 In 2022 inflation rose 7.8%, the largest annual increase since 1981.20 A series of surveys of over 1,000 adults aged 50 to 80 years found that rising food prices had affected food access for more than half of respondents, with 23% reporting buying fewer fruits and vegetables and 16% reporting buying less healthy food items.28
Distance to stores, transportation challenges, and neighborhood safety concerns can also limit food access for older adults.28,29 Those living in low-income, predominantly minority neighborhoods may have more difficulty accessing affordable, nutritious foods due a greater number of food sources with limited and lower quality options, like fast food outlets and convenience stores, and fewer full-service grocery stores.17,30,31 Health and physical mobility issues can exacerbate these older adults’ challenges.9,29,30
Health and Physical Function
Chronic health conditions and functional limitations that inhibit older adults’ ability to shop for and prepare foods can contribute to FI.6,9 The majority of older Americans reported having at least one chronic health condition in 2020 and many had multiple conditions, most commonly hypertension (58%), arthritis (47%), cancer (26%), diabetes (21%), and heart disease (14%).12 Furthermore, 18% of older adults reported a disability, including physical, cognitive, and communication issues, and 39% reported difficulties in getting around.12
A data analysis of adults aged 50 and over from the Health Care and Nutrition Study found that those with two or more chronic health conditions were more likely to have FI.32 FI rates in older adults with impairments in their activities of daily living (ADL), including cognitive, visual, hearing, ambulatory, or self-care deficits, are over twice those of nondisabled older adults and FI rates are four times higher in older adults not working due to a disability than in those who have retired.15
Higher health care costs in combination with chronic conditions can further threaten older adults’ food security; in 2020 older adults spent 14% of their income on health care expenses, compared with 8.4% for all consumers, and their average out-of-pocket health care costs were up 38% from 2010.12 Low-income older adults may have to choose between purchasing medications or food.6,23,33,34
Older adults with disabilities may be more vulnerable to FI due to multiple factors; data from adults aged 50 and over indicated that those with worsening ADL limitations at the start of the pandemic had over four times higher odds of FI, likely due to their inability to work, increased disability-related expenses, and difficulties accessing food.26 A recent analysis of National Health and Nutrition Examination Survey (NHANES) data from almost 5,000 older adults found that over 5% of them faced both economic FI and physical FI, measured with questions about their ability to shop for and prepare food.9
The Nutrition and Health Effects of FI in Older Adults
A diet high in essential nutrients with adequate fiber and limited sugar, refined carbohydrates, saturated fat, and sodium is crucial for older adults to reduce their risk of chronic diseases like hypertension, CVD, diabetes, and osteoporosis.35,36 Consuming a nutrient-dense diet is critical for older adults since they typically have lower calorie needs in conjunction with higher requirements for some essential nutrients, including calcium, vitamin D, and vitamin B6. Older adults also tend to be low in vitamin B12, thiamin, vitamin E, magnesium, potassium, and zinc.35-37 Additionally, older adults may need more protein than the current RDA of 0.8 g/kg; studies suggest that protein intakes in the range of 1 to 1.2 g/kg are associated with reduced frailty in older adults, with a recommended intake of about 25 to 30 g of protein per meal to reduce sarcopenia, the loss of muscle mass and function that occurs with aging.36,38
Aging presents many potential barriers to optimal nutrient intake, including altered taste and olfaction, changes in hormone levels related to appetite and satiety, and reduced absorption and digestion of critical nutrients.36 Older adults may also face problems with chewing and swallowing, chronic diseases and restrictive therapeutic diets, polypharmacy, dementia, depression, and social isolation, all of which can negatively impact their nutrition.35
FI exacerbates the nutrition challenges faced by older adults. Older adults with FI have been found to have lower intakes of food, calories, and multiple essential nutrients, and less healthful diets generally compared with food-secure older adults.34 Older adults facing FI have reported buying cheaper foods, which tend to be less nutrient-dense, reducing variety, skipping meals, and watering down foods, leading to the consumption of poorer quality diets.15,19,23,30,39 A recent analysis of NHANES data from over 5,000 older adults (aged 60 and over) with incomes at 300% of the FPL found that both FI and marginal FI were associated with lower scores on multiple measures of diet quality, including the Healthy Eating Index (HEI-2015), the Alternate Healthy Eating Index (AHEI-2010), and the Mediterranean diet; high scores on these measures have been associated with significantly lower risks of multiple chronic diseases and all-cause mortality.19
Analyses of NHANES data have consistently found that food-insecure older adults have significantly lower (in the range of 8% to 24% lower) intakes of energy and several key nutrients, including protein, calcium, iron, magnesium, vitamin B6, riboflavin, thiamin, vitamin A, and vitamin C, than do food-secure older adults.23,40 Many of these are nutrients of concern in older adults. FI, especially when it’s more severe, has been linked with malnutrition in older adults.39 Estimates indicate that nearly 25% of community-dwelling older adults and 33% of older adults admitted to hospitals are malnourished.23 Malnutrition has been associated with poorer outcomes among hospitalized older adults, including higher rates of readmission and increased mortality.41
FI in older adults has been linked with poorer overall physical and mental health. In a recent survey, 45% of adults aged 50 to 80 years with FI reported poor or fair physical health, compared with only 14% of those who were food secure, and 24% of those with FI reported poor or fair mental health, compared with only 5% of those who were food secure.42 Older adults who experienced FI during the early days of the pandemic due to nonfinancial, presumably mobility-related factors were more likely to report poor or fair health and a household diagnosis of COVID-19.43 One large analysis of NHANES data found that older adults facing both economic and physical FI had significantly lower diet quality (measured by HEI-2015), higher likelihood of several chronic health conditions, and higher odds of depression.9
Another analysis of NHANES data revealed that older adults with FI had almost three times the likelihood of screening positive for depression compared with food-secure older adults.40 FI has also been linked with poorer cognitive function in older adults.44,45 A recent cohort study of over 7,000 US adults aged 50 and over found that participants with FI had significantly poorer memory function and higher odds of dementia than those who were food secure.46
Older adults with FI also have significantly higher rates of multiple chronic physical conditions, including hypertension, CVD, diabetes, chronic lung disease, arthritis, and gum disease; higher incidence of heart attack and stroke; and higher likelihood of ADL limitations.40,44,47 Milder FI has been linked to overweight in older adults; multiple studies have found higher BMI and higher rates of obesity and weight-related disability in older adults with marginal FI or FI, particularly women, likely due in part to their consumption of lower quality diets.30,32,39,41 Inconsistent and less healthful food intake due to FI may also negatively impact blood sugar levels in older adults. In adults, including older adults, with diabetes FI has been associated with poorer glycemic control due to poorer diet quality, though research on the effects of FI on HbA1c levels hasn’t found consistent results.48-50 Older adults with FI also have a higher likelihood of medication nonadherence and are more likely to be hospitalized.32,40,51
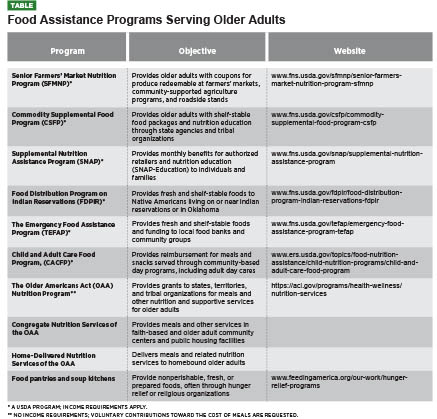
Food Assistance Programs Available to Older Adults
Food assistance programs are meant to improve the food security and nutrition of older adults and help them retain independence.5 Most (96%) of older Americans living in the community wish to stay in their own home as long as they can.5
The Administration for Community Living’s Administration on Aging provides grants through the Older Americans Act (OAA) Nutrition Program for states, territories, and tribal organizations to tailor Congregate and Home-Delivered Nutrition Services to adults aged 60 and over in the community who are in the greatest economic and social need, particularly those who have limited English proficiency or are low-income, minorities, located in rural areas, or at risk of institutional care.52 The program serves about 2.2 million older adults, providing an estimated 900,000 meals per day across the United States.52,53
There are also several food assistance programs administered by the USDA that serve older adults in need. The largest of these is SNAP, which provides monthly nutrition assistance benefits to millions of low-income individuals and families, including older adults.54
Addressing Barriers to Program Participation
Numerous barriers and challenges can keep older adults from benefiting from available food assistance programs. A lack of information on accessing programs can limit their participation. Over one-third of surveyed low-income adults aged 50 years and over indicated that information on enrolling in nutrition programs would help them eat more nutritious foods.55
Older adults who qualify for SNAP benefits are far less likely to participate than are other groups, with only 42% of eligible US older adults (aged 60 and over) enrolled.56 This reflects a significant increase from an even lower (33%) participation rate in 2010.57 Some reasons for older adults’ low SNAP participation rates are a lack of awareness of their eligibility, stigma, the belief that benefit amounts will be low, discouragement over the application process, mobility issues, and technology challenges.4,10,24,58 States with lower proportions of older adults enrolled in SNAP tend to be larger and more rural and are less likely to have simplified online enrollment systems.59 The majority of participating households with older adults aren’t receiving their maximum SNAP benefit due to the burdensome process of deducting and verifying qualified medical expenses; because of this, some states use a standard deduction.60 Suggestions from surveyed older adults participating in or eligible for SNAP include improving outreach to qualified older adults, perhaps through health care providers, simplifying enrollment, increasing benefit amounts, extending certification periods, and taking special dietary needs into account.61,62 Application assistance and simplifying enrollment and certification have been found to increase SNAP participation among older adults.5
Older adults may be denied critical food assistance due to inadequate funding. The demand for OAA Nutrition Programs has long outpaced its funding. The number of older adults requesting services has gone up significantly since the pandemic and funding increases have not kept up with higher costs; many providers have waiting lists for older adults in need.10,53
Older adults may also have difficulty obtaining the foods they need from food pantries. In a nationwide survey within the Feeding America Senior Hunger Network, adults aged 55 years and over utilizing a variety of food assistance programs identified various challenges, including difficulties with accessing or transporting food and concerns over foods not meeting their dietary needs.63 Participants suggested providing more canned fruits, vegetables, and protein, fresh produce and protein, expensive items such as cooking oil, spices, and condiments, and easily prepared items like cereal and canned soups. Other requests included home delivery and the inclusion of simple recipes with food items.63
Online options for food assistance programs may also benefit older adults, especially those with health or mobility issues. According to an AARP Foundation survey, the percentage of older adult SNAP participants ordering food online increased dramatically
during the pandemic as more online retailers accepted benefits.64
Older adults who have difficulty preparing meals due to disability, homelessness, or other factors would benefit from greater access to prepared foods.25 While SNAP doesn’t generally cover the purchase of hot, prepared foods, the SNAP Restaurant Meals Program allows older adults to use their benefits at participating restaurants; however, it’s currently only available in nine states.10,65
Food Assistance Programs’ Impact on FI
Participating in food assistance programs improves older adults’ food security to varying degrees. Research has found that SNAP generally reduces FI by 10% to 30%, depending on benefit amounts.5,66 In a 2019–2020 survey of older adult SNAP applicants, those who received benefits reported food security increases of about 22% over a six-month period, compared with 12.5% for those who didn’t receive benefits. Food security increases among SNAP recipients correlated strongly with the benefit amount; older adults receiving larger amounts were much more likely to report significant increases in their food security than those receiving smaller amounts (researchers noted that pandemic stimulus payments may have also impacted participants’ food security during the study period).67
In a small survey, older adult SNAP recipients reported that increased benefits during the pandemic allowed them to buy more food, including greater variety and more fruits and vegetables, and reduced their need for other food assistance programs.61 In an AARP Foundation survey of 1,000 SNAP participants aged 50 and over with high levels of FI, 24% of respondents reported improvements in their food security during the pandemic, likely due to the benefit increases.64 However, 27% reported visiting a food pantry monthly, both pre- and postpandemic.64
OAA Nutrition Program participants have significant FI risk factors; over half live alone and 48% of home-delivered meal participants have difficulty leaving home.52 Participants in congregate meal programs have reported lower rates of FI compared with a matched sample of nonparticipants.33 The data for home-delivered meal participants has been more mixed; some studies have found improved FI in participants, but one large evaluation found that participants had similar rates of FI to nonparticipants, with a higher prevalence of very low food security among participants who received fewer than five meals per week (a minority of participants).5,33 A considerable number of Nutrition Program participants still struggle with FI, including over 16% of congregate meal participants and 22% of home-delivered meal participants, and some report obtaining additional food from food pantries or soup kitchens.68 Older adults surveyed by Feeding America have indicated that the organization’s food assistance programs helped them extend their food supply through the month.63
Nutrition and Health Effects of Food Assistance Programs
Participation in food assistance programs provides many benefits for older adults’ nutrition and health. Although these benefits vary depending on program offerings and participants’ health status, they can include higher nutrient intake and diet quality, better health outcomes, better mood and cognitive function, and more socialization.
The limited data on nutrition and health effects in older adult SNAP recipients, 80% of whom live alone, has been mixed.59 In a survey of low-income SNAP enrollees aged 50 and over, 54% reported eating the same number of nutritious foods since enrolling, 23% said their intake of nutritious foods had increased, and 20% said it had decreased.55 Analyses of NHANES data have found older adult SNAP participants’ overall diet quality (according to HEI) and intake of empty calories and sodium to be similar to that of nonparticipants.69
However, SNAP participants’ use of benefits at farmers’ markets has increased substantially in recent years.5 There’s evidence that providing fresh fruits and vegetables through food assistance programs and education on their health benefits via programs like SNAP-Education increases older adults’ produce intake, which can have numerous positive effects on their physical and mental health.5,35,44,63
Some studies have found that SNAP participation has significant health benefits for older adults (or groups including older adults), including better self-reported health, lower health care expenses, moderately decreased cost-related diabetes medication nonadherence, and reduced risk of hospitalization and nursing home admission.70-74 A recent study of 115,868 SNAP-eligible older adults in North Carolina found that SNAP enrollment, though only 4.4% in this cohort, was associated with significantly fewer hospitalizations, emergency department visits, and admissions to long term care facilities and reduced Medicaid spending.75
Research indicates that participation in OAA Nutrition Programs also offers significant benefits for older adults’ health and nutrition. Program meals contribute greatly to participants’ intake; in a large program evaluation, 46% of congregate meal participants indicated that one meal provided half or more of their food for the day.52 Evaluation data confirmed that participants obtained close to half of their calorie and nutrient needs from congregate meals and were more likely than a matched sample of nonparticipants to have adequate intakes of several essential micronutrients, including vitamin B6, vitamin B12, and zinc.33 Furthermore, 76% of congregate meal participants reported eating more healthfully due to the meal program and, although they were more likely to have excessive sodium intakes, they had a higher overall diet quality (measured by HEI), including higher fruit, vegetable, and dairy intake, and lower intake of refined grains.33,52
Home-delivered meal participants are a high-risk group nutritionally, with a considerable number reporting a reduced appetite, dental or gum issues that interfere with eating, and the inability to prepare a hot meal.33,52 In a large evaluation, 60% of home-delivered meal participants indicated that their meal provided half or more of their food intake for the day, and data indicated that they obtained close to half of their daily calories and 35% to 47% of their intake of all examined nutrients from program meals.33,52 They were more likely than were a matched sample of nonparticipants to have adequate intakes of vitamin B6, vitamin D, and zinc.33 Additionally, 76% reported eating more healthfully due to the meal program, although their HEI scores were similar to those of nonparticipants.33 Other studies have found improved energy and protein intake among home-delivered meal recipients.5
OAA Nutrition Programs seem to positively affect the health outcomes of participants. A recent evaluation found that Indigenous elders receiving either congregate or home-delivered meals had significantly fewer hospitalizations and falls than nonparticipants.76 Program evaluations have also found that congregate meal program participants had lower health care utilization than nonparticipants and significantly lower rates of hospital admission and readmission.77,78 Additionally, 72% of surveyed congregate meal participants reported that their health had improved as a result of the program and 75% reported that the meals helped them to stay in their home; evaluation data indicated that low-income participants were less likely to be admitted to a long term care facility within three years than were nonparticipants.52,77,78
The data on health benefits for home-delivered meal participants is more mixed; an evaluation found higher health care utilization for those participants who had higher incomes or lived with others.77 However, other studies have found that receiving home-delivered meals reduced older adults’ risk of falls, hospital readmissions, and nursing home admissions.5 Furthermore, 91% of surveyed home-delivered meal recipients reported that the meals helped them to stay in their home.52
Food assistance programs may also benefit the cognitive and mental health of participating older adults. A recent study of over 4,000 adults aged 65 and over found that SNAP participants experienced slower cognitive decline than SNAP-eligible nonparticipants.45 Participation in food assistance programs and improved access to fruits and vegetables have also been associated with improved mental health and lower depression levels in older adults at risk of FI.44 Among Indigenous elders, receiving either congregate or home-delivered meals was associated with better mental health and more socialization.76 In a large survey, congregate meal participants reported greater satisfaction with their opportunities to socialize and were less likely to screen positive for depression than were nonparticipants; however, there were no significant differences in these measures between home-delivered meal participants and nonparticipants.33
Future Approaches to FI
Improving older adults’ access to food assistance programs that meet their needs is critical.26,29 Health care providers, hunger relief organizations, government agencies, and researchers are working toward innovative solutions for better identifying and serving older adults with FI. In 2022 the White House Conference on Hunger, Nutrition, and Health brought together multiple stakeholders with the goal of ending hunger in the United States within 10 years.79 Participating organizations including AARP and the Administration for Community Living pledged more research on FI in older adults, expanded awareness of SNAP benefits for older adults, and increased funding for OAA Nutrition Programs. Other proposals to benefit older adults included expanding SNAP’s online shopping program and aligning OAA Nutrition Programs with FDA’s sodium reduction goals.79
Additional, ongoing endeavors include community-clinical partnerships to increase FI screening and referrals of older adults at risk, health care providers offering prescriptions for healthful foods from food pharmacies, local food pantries, or farmers’ markets, OAA Nutrition Programs refining meals to reduce waste, expand services, and better meet older adults’ dietary needs and preferences, and community food assistance programs offering more older adult-specific services like mobile pantries and foods and recipes tailored to older adults’ nutrition requirements.47,50,53,63,80-87
Putting It Into Practice
Nutrition professionals can contribute to these efforts to improve older adults’ food security through advocacy, research, and enhanced screening and assistance for FI.5 The Academy of Nutrition and Dietetics advises nutrition professionals to “take a leadership role in identifying, addressing, and preventing food insecurity within their scope of practice.”6
Older adults’ tendency to make frequent visits to health care providers offers opportunities to identify those at risk of FI.4,88 Providers often work the two-question Hunger Vital Sign screening tool into routine patient intake procedures and then refer patients in need to local community partners such as food pantries or Area Agencies on Aging or to RDs or case managers when they’re available.86,88 Nutrition professionals should ensure the use of validated FI screening protocols for older adults and work with other clinicians and community partners to best meet the needs of those at risk.5,6 Nutrition professionals must consider food accessibility when assessing, counseling, and educating older adults.6,7 They can help older adults at risk of FI to optimize their nutrition intake by providing budget-friendly ideas for procuring and preparing healthy foods, including minimizing food waste.
Understanding the risk factors for and effects of FI on older adults and the benefits of available food assistance programs can help nutrition professionals to better identify and assist those at risk. Furthermore, consideration of the specific needs, challenges, and preferences of older adults facing FI and recent, innovative efforts to help them may inspire nutrition professionals to advance solutions to this critical and growing public health issue.
— Sara Chatfield, MPH, RDN, LDN, is a Chicago-based freelance nutrition writer who has practiced dietetics in clinical and community settings, including transitional care units with a focus on geriatric patients.
Learning Objectives
After completing this continuing education course, nutrition professionals should be better able to:
1. Describe six factors related to food insecurity (FI) in older adults.
2. Explain several nutrition and health consequences of FI in older adults.
3. Outline seven food assistance programs that serve older adults with FI.
4. Advocate for improved food security in older adults.
Examination
1. Which of the following is a risk factor for food insecurity (FI) in older adults?
a. Living with a partner
b. Being 80 years or older
c. Belonging to a racial or ethnic minority group
d. Residing in a metro area
2. What is one common coping strategy reported by older adults with FI?
a. Buying foods in bulk
b. Buying cheaper food
c. Asking neighbors to share food
d. Shopping at convenience stores
3. National Health and Nutrition Examination Survey data indicates that older adults with FI have lower intakes of which of the following?
a. Fat
b. Protein
c. Carbohydrates
d. Sodium
4. Older adults with FI have significantly higher rates of which of the following?
a. Cancer
b. Influenza
c. Osteoporosis
d. CVD
5. Which food assistance program provides older adults with coupons for fresh produce?
a. Commodity Supplemental Food Program (CSFP)
b. SNAP
c. Older Americans Act (OAA) Nutrition Program
d. Senior Farmers’ Market Nutrition Program
6. Older adults have lower participation rates than other age groups in which federal food assistance program?
a. SNAP
b. Feeding America Senior Hunger Network
c. Food Distribution Program on Indian Reservations
d. CSFP
7. What percentage of OAA home-delivered meal participants indicated upon survey that they still struggle with FI?
a. 12%
b. 16%
c. 22%
d. 27%
8. Surveyed older adults reported that increased SNAP benefits during the pandemic enabled them to purchase more of which types of food?
a. Snacks
b. Fruits and vegetables
c. Meats
d. Restaurant meals
9. What percentage of surveyed OAA congregate meal participants indicated that their meal provided half or more of their food for the day?
a. 32%
b. 46%
c. 55%
d. 66%
10. What is one strategy found to increase SNAP participation among older adults?
a. Providing electronic benefits
b. Verifying deducted medical expenses
c. Allowing purchase of prepared foods
d. Simplifying the enrollment process
References
1. U.S. Department of Agriculture Economic Research Service. Household Food Security in the United States in 2022. https://www.ers.usda.gov/webdocs/publications/107703/err-325.pdf?v=6828.4. Published October 2023. Accessed October 30, 2023.
2. U.S. Department of Agriculture Economic Research Service. Household Food Security in the United States in 2021. https://www.ers.usda.gov/publications/pub-details?pubid=104655. Published September 2022. Accessed October 30, 2023.
3. Food security in the US — survey tools. U.S. Department of Agriculture Economic Research Service website. https://www.ers.usda.gov/topics/food-nutrition-assistance/food-security-in-the-u-s/survey-tools/#U.S.%20Adult%20Food%20Security%20Survey%20Module. Updated January 8, 2025. Accessed April 11, 2025.
4. Pooler JA, Hartline-Grafton H, DeBor M, Sudore RL, Seligman HK. Food insecurity: a key social determinant of health for older adults. J Am Geriatr Soc. 2019;67(3):421-424.
5. Saffel-Shrier S, Johnson MA, Francis SL. Position of the Academy of Nutrition and Dietetics and the Society for Nutrition Education and Behavior: food and nutrition programs for community-residing older adults. J Acad Nutr Diet. 2019;119(7):1188-1204.
6. Holben DH, Marshall MB. Position of the Academy of Nutrition and Dietetics: food insecurity in the United States. J Acad Nutr Diet. 2017;117(12):1991-2002.
7. Wetherill MS, White KC, Rivera C. Food insecurity and the Nutrition Care Process: practical applications for dietetics practitioners. J Acad Nutr Diet. 2018;118(12):2223-2234.
8. Tucher EL, Keeney T, Cohen AJ, Thomas KS. Conceptualizing food insecurity among older adults: development of a summary indicator in the National Health and Aging Trends Study. J Gerontol B Psychol Sci Soc Sci. 2021;76(10):2063-2072.
9. Vaudin AM, Moshfegh AJ, Sahyoun NR. Measuring food insecurity in older adults using both physical and economic food access, NHANES 2013-18. J Nutr. 2022;152(8):1953-1962.
10. Lee JS. Food insecurity in older adults. J Nutr. 2022;152(8):1808-1809.
11. US Census Bureau. Demographic Turning Points for the United States: Population Projections for 2020 to 2060. https://www.census.gov/content/dam/Census/library/publications/2020/demo/p25-1144.pdf. Revised February 2020. Accessed October 30, 2023.
12. Administration for Community Living. 2021 Profile of Older Americans. https://acl.gov/sites/default/files/Profile%20of%20OA/2021%20Profile%20of%20OA/2021ProfileOlderAmericans_508.pdf. Published November 2022. Accessed October 30, 2023.
13. Caplan Z. 2020 census: 1 in 6 people in the United States were 65 and over. United States Census Bureau website. https://www.census.gov/library/stories/2023/05/2020-census-united-states-older-population-grew.html. Updated May 25, 2023. Accessed October 30, 2023.
14. By 2030, all baby boomers will be age 65 or older. United States Census Bureau website. https://www.census.gov/library/stories/2019/12/by-2030-all-baby-boomers-will-be-age-65-or-older.html. Updated December 10, 2019. Accessed October 30, 2023.
15. Ziliak JP, Gunderson C; Feeding America. The State of Senior Hunger in America in 2021: An Annual Report. https://www.feedingamerica.org/sites/default/files/2023-04/State%20of%20Senior%20Hunger%20in%202021.pdf. Published April 26, 2023. Accessed October 30, 2023.
16. Engelhard E, Hake M; Feeding America. Food Security Evidence Review: Key Drivers and What Works to Improve Food Security. https://www.feedingamerica.org/sites/default/files/2021-07/Food%20Security%20Evidence%20Review%20July%202021.pdf. Updated July 2021. Accessed October 30, 2023.
17. Food insecurity. U.S. Department of Health and Human Services Office of Disease Prevention and Health Promotion Healthy People 2030 website. https://health.gov/healthypeople/priority-areas/social-determinants-health/literature-summaries/food-insecurity. Accessed October 23, 2023.
18. Leung CW, Kullgren JT, Malani PN, et al. Food insecurity is associated with multiple chronic conditions and physical health status among older US adults. Prev Med Rep. 2020;20:101211.
19. Leung CW, Wolfson JA. Food insecurity among older adults: 10‐year national trends and associations with diet quality. J Am Geriatr Soc. 2021:69(4):964-971.
20. Income, poverty and health insurance coverage in the United States: 2022. United States Census Bureau website. https://www.census.gov/newsroom/press-releases/2023/income-poverty-health-insurance-coverage.html. Published September 12, 2023. Accessed October 30, 2023.
21. Shrider EA, Creamer J. Poverty in the United States: 2022. United States Census Bureau website. https://www.census.gov/library/publications/2023/demo/p60-280.html. Published September 12, 2023. Accessed October 30, 2023.
22. The Supplement Poverty Measure (SPM) and children: how and why the SPM and official poverty estimates differ. Social Security Office of Research, Evaluation, and Statistics website. https://www.ssa.gov/policy/docs/ssb/v75n3/v75n3p55.html. Published 2015. Accessed October 30, 2023.
23. Lloyd JL; Meals on Wheels America. Hunger in older adults: challenges and opportunities for the aging services network. https://www.mealsonwheelsamerica.org/docs/default-source/research/hungerinolderadults-fullreport-feb2017.pdf?sfvrsn=2. Published February 2017. Accessed October 27, 2023.
24. Oemichen M, Smith C. Investigation of the food choice, promoters and barriers to food access issues, and food insecurity among low-income, free-living Minnesotan seniors. J Nutr Educ Behav. 2016;48(6):397-404.
25. Tong M, Tieu L, Lee CT, Ponath C, Guzman D, Kushel M. Factors associated with food insecurity among older homeless adults: results from the HOPE HOME study. J Public Health (Oxf). 2019;41(2):240-249.
26. Nicklett EJ, Cheng GJ, Morris ZA. Predictors of food insecurity among older adults before and during COVID-19 in the United States. Front Public Health. 2023;11:1112575.
27. Ziliak JP. Food hardship during the COVID-19 pandemic and Great Recession. Appl Econ Perspect Policy. 2021;43(1):132-152.
28. Keenan A, Lampkin C. 2022 hunger trends among adults 50-plus. AARP website. https://www.aarp.org/content/dam/aarp/research/surveys_statistics/health/2023/hunger-trends-among-adults-50-plus.doi.10.26419-2Fres.00586.001.pdf. Published February 2023. Accessed October 30, 2023.
29. Savin K, Morales A, Levi R, Alvarez D, Seligman H. “Now I feel a little bit more secure”: the impact of SNAP enrollment on older adult SSI recipients. Nutrients. 2021;13(12):4362.
30. Choi YJ, Crimmins EM, Ailshire JA. Food insecurity, food environments, and disparities in diet quality and obesity in a nationally representative sample of community-dwelling older Americans. Prev Med Rep. 2022;29:101912.
31. Byker Shanks C, Haack S, Tarabochia D, Bates K, Christenson L. Factors influencing food choices among older adults in the rural western USA. J Community Health. 2017;42(3):511-521.
32. Jih J, Stijacic-Cenzer I, Seligman HK, Boscardin WJ, Nguyen TT, Ritchie CS. Chronic disease burden predicts food insecurity among older adults. Public Health Nutr. 2018;21(9):1737-1742.
33. Mabli J, Gearan E, Cohen R, et al. Evaluation of the effect of the Older Americans Act Title III-C Nutrition Services Program on participants’ food security, socialization, and diet quality. Administration for Community Living website. https://acl.gov/sites/default/files/programs/2017-07/AoA_outcomesevaluation_final.pdf. Published April 21, 2017. Accessed October 17, 2023.
34. Gundersen C, Ziliak JP. Food insecurity research in the United States: where we have been and where we need to go. Appl Econ Perspect Policy. 2018;40(1):119-135.
35. Napierkowski DB, Prado KB. Nutritional needs in the older adult, guidelines and prevention strategies to optimize health and avoid chronic disease. Geriatrics, Gerontology and Aging. 2021;15.
36. Kaur D, Rasane P, Singh J, et al. Nutritional interventions for elderly and considerations for the development of geriatric foods. Curr Aging Sci. 2019;12(1):15-27.
37. Thiamin. National Institutes of Health Office of Dietary Supplements website. https://ods.od.nih.gov/factsheets/Thiamin-HealthProfessional/. Updated February 9, 2023. Accessed October 30, 2023.
38. Richter M, Baerlocher K, Bauer JM, et al. Revised reference values for the intake of protein. Ann Nutr Metab. 2019;74(3):242-250.
39. Pereira MHQ, Pereira MLAS, Campos GC, Molina MCB. Food insecurity and nutritional status among older adults: a systematic review. Nutr Rev. 2022;80(4):631-644.
40. Ziliak JP, Gunderson C; Feeding America. The Health Consequences of Senior Hunger in the United States: Evidence from the 1999-2016 NHANES. https://www.feedingamerica.org/sites/default/files/2021-08/2021%20-%20Health%20Consequences%20of%20Senior%20Hunger%201999-2016.pdf. Published August 18, 2021. Accessed October 30, 2023.
41. Edmisten A. Malnutrition and food insecurity in older adults. N C Med J. 2023;84(2):106-109.
42. University of Michigan National Poll on Healthy Aging. How Food Insecurity Affects Older Adults. https://deepblue.lib.umich.edu/bitstream/handle/2027.42/155333/NPHA_Food-Insecurity-Report-FINAL-05102020-doi.pdf?sequence=4&isAllowed=y. Published May 2020. Accessed October 30, 2023.
43. Choi SL, Men F. Food insecurity associated with higher COVID-19 infection in households with older adults. Public Health. 2021;200:7-14.
44. Bergmans RS, Wegryn-Jones R. Examining associations of food insecurity with major depression among older adults in the wake of the Great Recession [published correction appears in Soc Sci Med. 2023;333:116114]. Soc Sci Med. 2020;258:113033.
45. Na M, Dou N, Brown MJ, Chen-Edinboro LP, Anderson LR, Wennberg A. Food insufficiency, Supplemental Nutrition Assistance Program (SNAP) status, and 9-year trajectory of cognitive function in older adults: the Longitudinal National Health and Aging Trends Study, 2012-2020. J Nutr. 2023;153(1):312-321.
46. Qian H, Khadka A, Martinez SM, et al. Food insecurity, memory, and dementia among US adults aged 50 years and older. JAMA Netw Open. 2023;6(11):e2344186.
47. Gundersen C, Ziliak JP. Food insecurity and health outcomes. Health Aff (Millwood). 2015;34(11):1830-1839.
48. Berkowitz SA, Gao X, Tucker KL. Food-insecure dietary patterns are associated with poor longitudinal glycemic control in diabetes: results from the Boston Puerto Rican Health study. Diabetes Care. 2014;37(9):2587-2592.
49. Mayer VL, McDonough K, Seligman H, Mitra N, Long JA. Food insecurity, coping strategies and glucose control in low-income patients with diabetes. Public Health Nutr. 2016;19(6):1103-1111.
50. Ippolito MM, Lyles CR, Prendergast K, Marshall MB, Waxman E, Seligman HK. Food insecurity and diabetes self-management among food pantry clients. Public Health Nutr. 2017;20(1):183-189.
51. Garcia SP, Haddix A, Barnett K. Incremental health care costs associated with food insecurity and chronic conditions among older adults. Prev Chronic Dis. 2018;15:E108.
52. Nutrition services. Administration for Community Living website. https://acl.gov/programs/health-wellness/nutrition-services. Updated February 13, 2025. Accessed April 11, 2025.
53. Department of Health and Human Services Administration for Community Living. Fiscal Year 2024 Justification of Estimates for Appropriations Committees. Published 2023. Accessed October 30, 2023.
54. Supplemental Nutrition Assistance Program (SNAP). U.S. Department of Agriculture Economic Research Service website. https://www.ers.usda.gov/topics/food-nutrition-assistance/supplemental-nutrition-assistance-program-snap/. Updated March 8, 2023. Accessed October 12, 2023.
55. AARP Foundation. Findings on nutrition knowledge and food insecurity among older adults. https://dfq3h9wd5iwx4.cloudfront.net/multimedia/AARP-Foundation-Findings-on-Nutrition-Knowledge-and-Food-Insecurity-Among-Older-Adults.pdf. Published January 14, 2015. Accessed October 27, 2023.
56. SNAP map: SNAP matters to seniors. Food Research & Action Center website. https://frac.org/research/resource-library/snap-map-snap-matters-to-seniors. Updated 2023. Accessed October 30, 2023.
57. Trends in SNAP participation rates: FY 2010-2017. U.S. Department of Agriculture Food and Nutrition Service website. https://www.fns.usda.gov/snap/trends-participation-rates-fy-2010. Updated September 12, 2019. Accessed October 30, 2023.
58. Get the facts on SNAP and senior hunger. National Council on Aging website. https://www.ncoa.org/article/get-the-facts-on-snap-and-senior-hunger. Updated June 1, 2024. Accessed April 11, 2025.
59. Senior SNAP participation visualization. National Council on Aging website. https://www.ncoa.org/article/senior-snap-participation. Updated February 10, 2025. Accessed April 11, 2025.
60. Nearly 10 million households with adults ages 50 and older participated in the Supplemental Nutrition Assistance Program (SNAP) in 2022. AARP website. https://www.aarp.org/pri/topics/health/food-insecurity/millions-of-adults-ages-50-and-older-rely-on-snap/. Updated October 28, 2024. Accessed April 11, 2025.
61. The case for making SNAP benefits adequate: reflections from interviews with older adults. Food Research & Action Center website. https://frac.org/research/resource-library/fracaarpolderadultsinterviews2022. Published February 2022. Accessed October 30, 2023.
62. AARP Foundation. Older Adult SNAP Access. Social Policy Research Associates. Published 2021. Accessed October 30, 2023.
63. Frongillo EA, Warren AM; Feeding America. An evaluation report: senior food-assistance, related programming, and seniors’ experiences across the Feeding America network. https://www.feedingamerica.org/sites/default/files/research/senior-hunger-research/senior-hunger-evaluation.pdf. Updated April 2019. Accessed October 27, 2023.
64. AARP Foundation. COVID-19 Research Key Takeaways. Published December 2021. Accessed October 30, 2023.
65. SNAP Restaurant Meals Program. U.S. Department of Agriculture Food and Nutrition Service website. https://www.fns.usda.gov/snap/retailer/restaurant-meals-program. Updated April 8, 2025. Accessed April 11, 2025.
66. Keith-Jennings B, Llobrera J, Dean S. Links of the Supplemental Nutrition Assistance Program with food insecurity, poverty, and health: evidence and potential. Am J Public Health. 2019;109(12):1636-1640.
67. Gothro A, Chesnut K, Hu M, Briefel R; Mathematica. ESAP State Enrollment Data Collection Project Final Report. Published December 24, 2020. Accessed October 30, 2023.
68. Mathematica Policy Research. Needs of and service use among participants in the Older Americans Act Title III-C Nutrition Services Program. https://acl.gov/sites/default/files/programs/2018-11/AoAParticipantNeedProgramUse.pdf. Published October 5, 2018. Accessed October 17, 2023.
69. Andreyeva T, Tripp AS, Schwartz MB. Dietary quality of Americans by Supplemental Nutrition Assistance Program participation status: a systematic review. Am J Prev Med. 2015;49(4):594-604.
70. Kim J. Are older adults who participate in the Supplemental Nutrition Assistance Program healthier than eligible nonparticipants? Evidence from the Health and Retirement Study. Gerontologist. 2015;55(2 Suppl):672.
71. Pooler JA, Srinivasan M. Association between Supplemental Nutrition Assistance Program participation and cost-related medication nonadherence among older adults with diabetes. JAMA Intern Med. 2019;179(1):63-70.
72. Berkowitz SA, Seligman HK, Rigdon J, Meigs JB, Basu S. Supplemental Nutrition Assistance Program (SNAP) participation and health care expenditures among low-income adults. JAMA Intern Med. 2017;177(11):1642-1649.
73. Samuel LJ, Szanton SL, Cahill R, et al. Does the Supplemental Nutrition Assistance Program affect hospital utilization among older adults? The case of Maryland. Popul Health Manag. 2018;21(2):88-95.
74. Szanton SL, Samuel LJ, Cahill R, et al. Food assistance is associated with decreased nursing home admissions for Maryland’s dually eligible older adults. BMC Geriatr. 2017;17(1):162.
75. Berkowitz SA, Palakshappa D, Rigdon J, Seligman HK, Basu S. Supplemental Nutrition Assistance Program participation and health care use in older adults: a cohort study. Ann Intern Med. 2021;174(12):1674-1682.
76. Administration for Community Living. Evaluation of the ACL Title VI Programs Final Report. https://acl.gov/sites/default/files/programs/2021-05/ACL_TitleVI_Evaluation_Final_Report_508.pdf. Published March 2021. Accessed October 30, 2023.
77. Mabli J, Ghosh A, Schmitz B, et al. Evaluation of the effect of the Older Americans Act Title III-C Nutrition Services Program on participants’ health care utilization. https://acl.gov/sites/default/files/programs/2018-10/NSPevaluation_healthcareutilization.pdf. Published September 14, 2018. Accessed October 27, 2023.
78. Mathematica. Evaluation of the Effect of the Older Americans Act Title III-C Nutrition Services Program on Participants’ Longer-Term Health Care Utilization. https://acl.gov/sites/default/files/programs/2020-08/NSPevaluation_longertermhealth.pdf. Published July 28, 2020. Accessed October 30, 2023.
79. Fact sheet: the Biden-Harris Administration announces more than $8 billion in new commitments as part of call to action for White House Conference on Hunger, Nutrition, and Health. The White House website. https://bidenwhitehouse.archives.gov/briefing-room/statements-releases/2022/09/28/fact-sheet-the-biden-harris-administration-announces-more-than-8-billion-in-new-commitments-as-part-of-call-to-action-for-white-house-conference-on-hunger-nutrition-and-health/. Updated September 28, 2022. Accessed October 30, 2023.
80. Innovations in Nutrition Programs and Services. Administration for Community Living website. https://acl.gov/programs/nutrition/innovations-nutrition-programs-and-services-0. Updated July 6, 2023. Accessed October 30, 2023.
81. Lundeen EA, Siegel KR, Calhoun H, et al. Clinical-community partnerships to identify patients with food insecurity and address food needs. Prev Chronic Dis. 2017;14:E113.
82. What a waste: immediate and lasting impact. National Foundation to End Senior Hunger website. http://nfesh.org/what-a-waste/. Updated May 22, 2019. Accessed October 27, 2023.
83. DFSS Senior Services Congregate Dining Restaurant Program. Chicago website. https://www.chicago.gov/city/en/depts/fss/provdrs/senior/alerts/2023/march/dfss-senior-services-congregate-dining-restaurant-program.html. Updated March 30, 2023. Accessed October 30, 2023.
84. Food as Medicine: addressing hunger in the community. EpicShare website. https://www.epicshare.org/share-and-learn/food-as-medicine-addressing-hunger-in-the-community#_ftn6. Published September 13, 2021. Accessed October 30, 2023.
85. Preventative Food Pantry. Boston Medical Center website. https://www.bmc.org/nourishing-our-community/preventive-food-pantry. Updated 2023. Accessed October 12, 2023.
86. Social determinants of health series: food insecurity and the role of hospitals. American Hospital Association website. https://www.aha.org/ahahret-guides/2017-06-21-social-determinants-health-series-food-insecurity-and-role-hospitals. Updated 2023. Accessed October 27, 2023.
87. Cheyne K, Smith M, Felter EM, et al. Food bank–based diabetes prevention intervention to address food security, dietary intake, and physical activity in a food-insecure cohort at high risk for diabetes. Prev Chronic Dis. 2020;17:E04.
88. Pooler J, Levin M, Hoffman V, Karva F, Lewin-Zwerdling A; AARP Foundation. Implementing food security screening and referral for older patients in primary care: a resource guide and toolkit. https://www.aarp.org/content/dam/aarp/aarp_foundation/2016-pdfs/FoodSecurityScreening.pdf. Published November 2016. Accessed October 27, 2023.