
Today’s Dietitian
Vol. 19, No. 7, P. 50
Learn About Trends in Food Costs and Consumer Purchasing Behaviors to Help Clients Buy Healthful Foods on a Tight Budget.
Suggested CDR Learning Codes: 4010, 4070, 6010, 8018
Suggested CDR Performance Indicators: 7.2.6, 8.1.2, 8.4.5, 12.2.1
CPE Level 2
Take this course and earn 2 CEUs on our Continuing Education Learning Library
Shoppers’ budgets are stretched tight, and today’s food costs are influencing purchasing behaviors. Many believe that it’s expensive to eat healthfully. The latest consumer survey polls and expert opinions debunk this myth. Using appropriate shopping recommendations and purchasing strategies, RDs can help clients make healthful food choices regardless of their budgets.
With the prevalence of obesity and type 2 diabetes across the nation, the need for individuals to eat healthfully is obvious. According to a 2014 Nielsen study, 89% of Americans believe that taking personal responsibility is the best way to stay healthy, and 75% feel they can manage health issues through nutrition. However, when it comes to acting on these beliefs, only 70% report they’re actually “actively trying to be healthier,” and 50% say it’s challenging to eat healthfully.1 One difficulty is the cost of healthful food at the supermarket. A 2009 survey found that 65% of Americans believe grocery items are overpriced and should be cheaper.2
This continuing education course identifies and examines trends in food costs and consumer purchasing behaviors and provides recommendations and strategies consumers can use to purchase healthful foods on a tight budget.
Food Costs on the Rise
Many factors affect the price of food. An increase in food costs can be attributed to high gasoline prices, viral outbreaks, rising exports, and droughts affecting areas where most of the country’s food is grown. Over the past several years, droughts have thinned cattle herds and driven beef prices up 23%; viral outbreaks in the hog population have pushed pork prices up by 56%; and a California drought has led to higher prices of fruits and vegetables such as avocados, lettuce, and berries.3
According to the USDA Economic Research Service, in 2017, the overall cost of food purchased at supermarkets for meals consumed at home is expected to rise 0.5% to 1.5% due to the expectation that severe weather from previous years, such as droughts, will continue to affect food production in the future.4 Over the years, the inconsistent change in food costs has forced consumers to examine their grocery budgets. Higher food bills are changing the way Americans shop for groceries and are causing many shoppers to settle for cheap food at the expense of health and nutrition simply to put food on the table for their families.
Debunking the Myth
There’s a general perception that healthful foods cost more than unhealthful foods. Studies show that this perceived cost of healthful food is a barrier to purchasing nutritious options. A 2015 International Food Information Council Foundation food and health survey found that 26% of consumers see the cost of food as a hurdle to staying on track when it comes to their health.5 However, a report issued by the Congressional Research Service indicates that in the United States, prices for healthful foods aren’t increasing at the same rate as are those for processed food items. According to its data, prices for fresh fruits and vegetables tend to rise and fall based on an inflationary growth pattern that mirrors normal economic inflationary patterns (ie, they generally follow the Consumer Price Index, which measures changes in the prices paid by consumers for a representative market basket of goods and services), but processed foods do not. In fact, prices of highly processed foods and beverages are increasing at a rate that surpasses the Consumer Price Index.6
Furthermore, the USDA assessed the cost of healthful foods by comparing a variety of price metrics. A 2013 study looked at various food groups including grains, protein, dairy, fruits, vegetables, and moderation items—defined as products high in sodium, added sugar, or saturated fat and that didn’t contain ingredients from a recognized food group. The study compared these food groups for price per average portion, price per calorie, and price per weight as well as for the cost of meeting recommended dietary requirements. The analysis indicated that, with the possible exception of the price of food energy, it isn’t possible to conclude that healthful foods are more expensive than less healthful foods. In all instances, grains and dairy cost less than moderation foods. In addition, fruits cost less per average portion than moderation foods, and vegetables cost fewer dollars than moderation foods when compared by both average portion and weight. The analysis also showed that with respect to the cost of meeting recommended dietary requirements, grains and dairy are the least expensive food groups; fruit falls in the middle ground, and vegetable and protein recommendations are the most expensive.7
Food Assistance Programs
While healthful foods already may be less expensive than unhealthful foods, food assistance programs, manufacturers, and food delivery services continue to work hard to make healthful foods affordable and easily accessible.
A variety of food assistance programs such as the Supplemental Nutrition Assistance Program (SNAP) exist to help improve the nation’s nutrition and health and, as such, are geared toward addressing food insecurity and ensuring that women, infants, children, seniors, and people at nutritional risk in low-income environments have access to food and nutrition education. While SNAP purchases are at the discretion of the consumer and can include everything from highly processed snack foods to healthful fruits and vegetables, efforts have been made over the past several years to ensure that purchases from these programs are as healthful as possible.8
For example, in 2013, 18 mayors nationwide pushed for limits on soda and other sugar-sweetened beverages, which comprise 58% of beverages that households receiving SNAP benefits purchase.9 A pilot program in Massachusetts credited SNAP recipients with 30 cents for every dollar spent on fresh fruits and vegetables; this resulted in a 25% increase in the purchase of produce.10 The Double Up Food Bucks program, active in 10 states, matches SNAP recipients up to $20 per day for money spent on fresh produce and credits it to be used on future produce purchases.11 And more and more farmers’ markets are accepting SNAP program dollars to address the issue of access to affordable fresh produce.
Specialty Diet Manufacturers
Even though manufacturers of specialty diet and organic products are beset by certification fees and increased labor costs, demand for these products is increasing, and prices are expected to decline accordingly in the upcoming years. Specialty diet products such as gluten-free items, for example, tend to have higher price tags due to the costs associated with avoiding contamination throughout the process from field and manufacturing plant to the grocery store shelf. Moreover, certain alternatives to gluten-containing ingredients (eg, replacing white flour with almond flour) are more expensive, which in turn causes the products to cost two to three times more than their gluten-containing counterparts.12 However, the demand for gluten-free grocery items is projected to increase by 10% annually, and the cost for such products is expected to decrease accordingly.13 Meanwhile, consumers on gluten-free diets can best decrease their grocery bills by choosing naturally gluten-free foods such as fruits, vegetables, lean proteins, and gluten-free whole grains (eg, rice, quinoa, millet, amaranth, buckwheat) as opposed to processed alternatives such as gluten-free bread, muffins, cookies, and tortillas.
Certified organic food products also tend to be more expensive than their conventional counterparts for several reasons.14 In order to adhere to organic guidelines, producers experience increased costs—for example, for organic certification fees and increased labor needed to monitor production, manufacturing, and management of meticulous postharvest handling that’s required to meet organic standards. Currently, demand for organics exceeds supply, a situation that also contributes to the cost of organic food products. Sales of organic food have risen 20% annually; experts predict the industry’s share of the US food market will grow from about 2% to roughly 3.5% by 2020.15
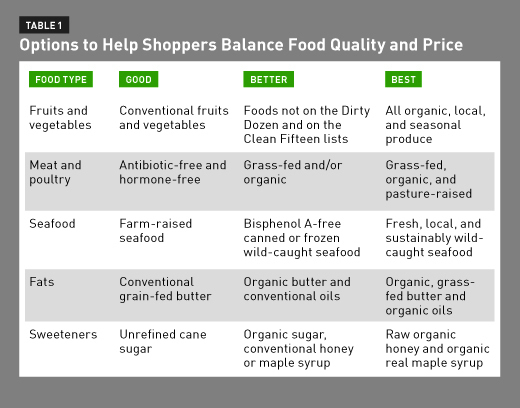
Consumers looking to purchase organic foods on a tight budget can review the “Dirty Dozen” and “Clean Fifteen” lists on the Environmental Working Group website (http://www.ewg.org/foodnews/summary.php). According to the Environmental Working Group, the Dirty Dozen refers to conventional, nonorganic fruits and vegetables that contain the highest amount of pesticide residues: strawberries, apples, nectarines, peaches, and celery currently round out the top five. Alternatively, produce items on the Clean Fifteen list contain the least amount of pesticides.16 Value shoppers looking for produce with low pesticide residuals should focus their choices on fruits and vegetables on the Clean Fifteen list and consider purchasing organic for those on the Dirty Dozen list.
Furthermore, balancing food quality and price for protein and fats also can be challenging when shopping on a budget. Foods recognized as the highest quality (eg, organic, grass-fed, and wild-caught) tend to come with the highest price tags. Table 1 outlines the good, better, and best options for such items based on nutrition and sustainability factors to help shoppers balance food quality and price in a way that works with their grocery budgets.
Grocery Delivery Services
When it comes to food choices, the demand for convenience is associated with time, and low-income households may be more pressed for time due to longer shifts and multiple jobs. In 2014, less than 60% of dinners served at home were cooked at home; this is a decrease from the 1980s, when the percentage was closer to 75%.17 This trend is expected to continue, so efforts to boost the healthfulness of the American diet via online grocery shopping and delivery services are focused on promoting the preparation of healthful foods at home while taking into consideration limits on time available for cooking.
According to a 2013 survey, nearly one-half of US shoppers (47%) choose to shop online rather than in stores so they can easily compare prices at different retailers.18 Services such as Peapod, AmazonFresh, and FreshDirect enable consumers to purchase groceries online and have them delivered directly to their doorsteps. These online programs help shoppers stick to their lists and avoid impulse buys; they also can review and change their purchases and thus can manipulate their final grocery bill before checking out. But while these services save time, consumers may wonder whether the products are any cheaper. The Wall Street Journal conducted a study to compare prices. Shoppers purchased identical grocery items from a variety of online and brick-and-mortar supermarkets. Results varied by region, but some showed online service, excluding the delivery charge, to be cheaper than the traditional store.19 Delivery charges for these services can range from $6 to $10, with larger orders reflecting a lower delivery cost than smaller orders. Depending on the size of the order and the value placed on convenience, these services may be worth the extra fee.
Services delivering healthful meals also are gaining popularity as more Americans strive to eat healthfully while spending less time in the kitchen. While Blue Apron, Plated, and HelloFresh lead the market, competition is slowly increasing and, therefore, prices for meals are expected to decrease. In 2015, MarketWatch conducted a test to compare the cost of ingredients when purchased at Whole Foods Market with those delivered by Blue Apron. The group tested three meals and results showed that two meals were less expensive (by more than $3) when made with ingredients purchased at Whole Foods and one was more expensive by 12 cents.20 While the cost of these services may not always be less expensive when compared with supermarket pricing, the value of meal planning assistance, premeasured ingredients, and portion control can help encourage cooking at home, avoid food waste, and support more healthful food choices long term.
Food Budget and Meal Planning
A large part of every individual’s or family’s income is spent on food, and grocery shopping on a tight budget can be challenging. The amount of money a family spends on food each week or month depends on a variety of factors including income and family size. The USDA offers monthly Cost of Food reports that highlight the average expense associated with a nutritious diet at different spending levels (Thrifty, Low-Cost, Moderate-Cost, and Liberal food plans). The January 2016 report showed that the average cost of food on the Thrifty Food Plan, which is the basis for the SNAP allotments, was $85 to $91 per week for a family of two (male and female aged 19 to 70) and $131 to $152 per week for a family of four (male and female aged 19 to 50 with children aged 2 to 11).21 When compared with the Low-Cost, Moderate-Cost, and Liberal food plans for a family of four, which average $182.75, $227.35, and $278.60, respectively, it’s obvious that strategic meal planning is key to effectively implementing a nutritious eating plan based on this weekly allotment.
Creating a calendar for what a family will serve and eat for a certain amount of time (eg, day, week, or month) and organizing recipes and ingredients that correspond with those selections can be part of meal planning. When it comes to what consumers most often use to help plan what they eat, meal plans ranked lowest at only 24%.22 Shopping lists ranked highest at 59%, followed by coupons at 53%, in-store discounts at 49%, and recipes at 45%. Opportunities to cook at home generally are connected to the availability of time. According to a trend study in Nutrition Journal, Americans are eating at home today less often than they did in the 1960s. Between the mid-1960s and the late 2000s, low-income households went from eating at home 95% of the time to only 72% of the time. Middle-income households went from eating at home 92% of the time to 69% of the time, and high-income households went from eating at home 88% of the time to only 65% of the time.23
Meals eaten at home generally are cheaper and more healthful than those eaten outside the home. An average meal for a family of four costs $20 at home compared with $60 at a restaurant. Children often consume greater quantities of fruits, vegetables, and whole grains when eating at home and tend to consume more soda and fried foods when dining out. In addition, on average, home-cooked meals have fewer calories than do those purchased at restaurants.24
By thinking about how many meals will be needed and how much time will be available for cooking and documenting the exact ingredients necessary to execute the plan, families can eat more meals at home, make more healthful choices, and save more money. RDs can direct their clients to a variety of free online tools, including the What’s Cooking USDA Mixing Bowl, which provides recipe inspiration to help plan meals and identify the ingredients necessary to prepare healthful meals.25
The Power of a List
An important part of food budgeting and meal planning is developing a shopping list. A well-planned shopping list can help shoppers make more healthful purchases, avoid impulse buys, and reduce food waste. A 2015 Journal of Nutrition Education and Behavior study demonstrated that using a grocery list is associated with a more healthful diet and a lower BMI. The study surveyed participants who reported an annual household income of less than $20,000 and found that 33% of the participants “always” relied on a grocery list when shopping, while 17% used a grocery list often, and 26% did so only occasionally. In addition, the study weighed participants and measured BMI. Results showed that using a grocery list correlated with lower BMI—approximately one point lower—when compared with not shopping with a grocery list.26
Twenty-six percent of Americans regularly go to the grocery store without a list,2 resulting in a high risk of unhealthful impulse purchases and buying more food than needed. The average supermarket layout is carefully engineered to tempt shoppers and encourage impulse purchases, mostly of unhealthful food products (eg, soda and candy at the checkout). The Food Marketing Institute estimates that sales of items displayed in the checkout aisle account for 1% of total sales and 1.3% of store profits.27 Moreover, the average American family of four spends $125 each month on food that’s thrown out.28 Encouraging families to develop effective shopping lists with which to implement weekly meal plans will help to encourage more healthful food choices (and fewer impulse buys) and will discourage overbuying and prevent food waste and, therefore, save money in the long run.
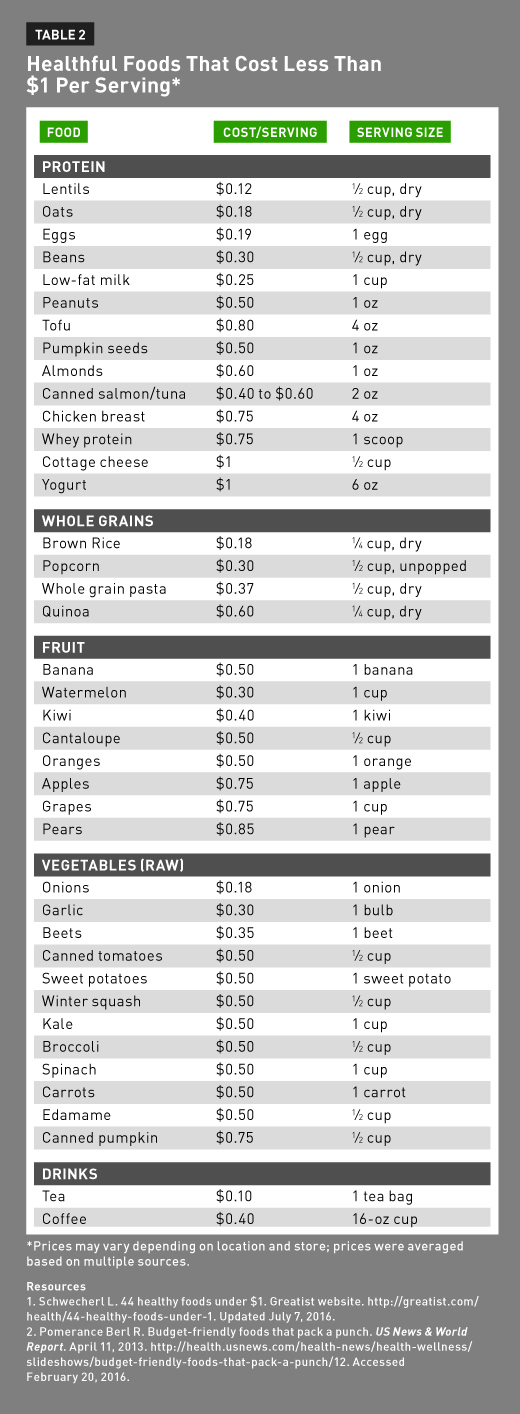
Whether shoppers opt for a handwritten note or a list created on a mobile device, a detailed list is essential to shopping and eating healthfully on a budget. And the healthful foods that are added to that list don’t have to break the bank. RDs can advise their clients about the foods in Table 2, which are good for the body and easy on the wallet.
Portion Control
Assessing portion sizes and emphasizing portion control at each meal is another way people on a budget can make their food dollars go farther. Many consumers confuse portion size (the amount of food eaten in a single eating occasion)29 with serving size, which is the standardized unit of measured food by the Dietary Guidelines for Americans. Portion sizes reflect how much people consume in an eating occasion, and studies show that people eat more when they’re presented with larger portion sizes. In fact, women consume more than 335 additional kcal per day than they did in 1971, and men consume 168 more kcal per day. Furthermore, portion sizes themselves have grown over the last 50 years. In the 1950s, a regular fast-food burger was 2.8 oz and 202 kcal. In 2004, the same burger was significantly larger at 4.3 oz and 310 kcal.30 Super-sized portions at restaurants have distorted what Americans consider a healthful portion size, and that affects how much is eaten at home as well. Consumers generally don’t correctly assess the amount of food they’re eating. RDs can guide clients to educational resources to help decrease portion sizes at ChooseMyPlate.gov31 and can use the following tips to help clients manage portion sizes when eating at home:
• Encourage clients not to eat directly from the package; suggest they divide snacks into single-serving portions when they get home from the store.32
• Suggest clients serve food on smaller plates and keep serving dishes on the kitchen counter so the opportunity for seconds is farther away.32
• Recommend clients fill one-half of their plate with green vegetables and divide the other one-half between lean protein and whole grains.32 According to a 2005 study in the American Journal of Clinical Nutrition, eating appropriate portions of foods with low energy density can help improve satiety and control hunger in circumstances of restricted calorie intake.33
Benefits of a Well-Stocked Pantry
A well-stocked and organized pantry can help save money in the long run for a variety of reasons. First, it encourages cooking at home, which means spending less on dining out. According to the Visa 2015 Lunch Spending Survey, consumers spend an average of $2,746 on lunch yearly—or $53/week.34 Furthermore, those making less money tend to spend more on dining out than do those who make more. Individuals who make less than $25,000 per year spend more per meal, $11.70, than do those in any other income bracket. In contrast, those earning more than $50,000 per year spend an average of $9.60 per meal, a difference of 22%.35 By spending more time cooking at home by way of keeping a pantry stocked with healthful ingredients—rather than relying on prepackaged meals or takeout—consumers have more control over the amount of money spent per meal.
Dietitians should encourage clients to keep their cupboards stocked with cooking essentials such as spices, oils, vinegars, beans, lentils, and dry whole grains, as well as canned fish, tomato products, and fruits and vegetables. Furthermore, freezer-friendly items such as frozen fruits, vegetables, and lean meats also have a long freezer shelf life. Buying these pantry staples in bulk when they go on sale can save consumers even more money.
Savings experts suggest buying in quantity items used most frequently when they go on sale. According to Jill Cataldo, founder of SuperCouponing.com, purchasing in bulk can help shoppers decrease costs of household food and goods by one-half.36
Fifty-eight percent of Americans buy grocery items in bulk to save money.2 For items purchased regularly, shoppers should consider purchasing larger packages. A simple scan of the unit price generally shows that items purchased in a larger size or quantity typically cost less per unit than their smaller counterparts. The Understand the Price Tag37 tool at ChooseMyPlate.gov demonstrates the difference between retail price and unit price and provides additional tips for how consumers can use this information to save.
Take to the Aisles
While convenience sometimes is worth the extra dollar when time is of the essence, one way to save money at the supermarket is to make simple items at home rather than purchasing the premade versions. Blending simple things such as dressings and spice mixtures from scratch can easily shave off some money from the grocery bill as well as other strategies.
Reconsider Premade Dressings and Spice Blends
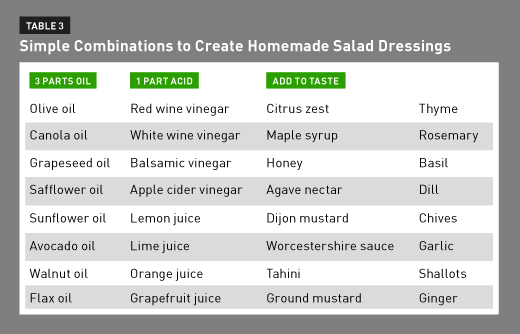
Condiments and spice blends that add flavor to meals can add unnecessary dollars to consumer grocery bills. Store-bought salad dressings can cost upwards of $2 to $4 per bottle, and the versatility of one dressing flavor can be limiting, leaving consumers with a fridge full of half-empty containers. The list of ingredients in these items also can include unhealthful added sugar, food colorings, artificial ingredients, and high sodium levels. In addition, the same holds true for many seasoning blends. If your pantry is stocked with a variety of spices, you can mix and match to inexpensively create your own spice blends. For example, Italian Seasoning is simply a blend of oregano, basil, rosemary, thyme, marjoram, and sage. Pumpkin Pie Spice is a mix of cinnamon, nutmeg, ginger, allspice, and cloves. With a well-stocked pantry, it’s easy to make homemade dressings and spice blends, which are simple and cost-effective ways to add flavor to salads and meals. Table 3 outlines ways you can advise clients to create unique flavor combinations to fit their cooking needs.
Give Generic Brands a Chance
One of the simplest ways clients can trim their grocery bills is to switch to generic store-brand products. Selling store-brand items rather than national brands often is more profitable for supermarkets. Therefore, major chains put additional efforts into bringing generics to the marketplace. It’s common for store brands to cost 25% to 30% less than their name-brand equivalents. It’s been reported store-brand sales at Safeway have been outpacing national brands by a ratio of 3 to 1.38 According to a 2014 study in the Journal of Retailing, sales of store brands have been increasing across the globe over the last two or three decades. In the United States, supermarket sales of store brands increased 5.1% in 2011. By comparison, national brands gained only 2% over the same period. While some may argue that money saved by purchasing generic brands comes at the expense of quality and flavor, recent survey results show an increase (from 57% in 2010 to 64% in 2012) in consumer agreement that brand names aren’t necessarily better quality.39 This suggests that the assumption that higher price means better quality is beginning to fade among today’s shoppers.
Using Coupons
For consumers less interested in generic-brand products, using coupons can help them save on everyday name-brand items. Sixty-six percent of US consumers use coupons to save on household items; in 2012, 2.9 billion coupons were redeemed,40 representing a collective $800 million in discounts, according to ILoveCouponMonth.com. From 2008 to 2013, the number of people living in households that used coupons for groceries in the United States grew from 171 million to 181 million, and today the use of coupons accounts for more than $3 billion in transactions. Today’s consumers are collecting coupons from the Sunday newspaper, in-store sales flyers, and online resources. In fact, with the modernization of coupon use, mobile coupons are 10 times more likely than traditional coupons to be redeemed.41 The level of coupon use can range from casual to consistent, but regardless, the savings can add up.
Some consumers complain they can’t find coupons for products they want to buy and that coupons are seemingly plentiful for highly processed cereals, frozen foods, snacks, and candy, while remaining limited for healthful foods. Therefore, it may be best to advise clients to use coupons on nonfood items to ensure that unhealthful foods don’t fill their baskets simply because they’re on sale. Of the 305 billion coupons offered in 2012, 4.4% were for nonfood items such as medications, personal care, and other household products.41
Buying in Bulk
Buying in bulk can help reduce packaging waste and save consumers money. Bulk inventory bins are becoming increasingly popular at supermarkets nationwide, offering shoppers the opportunity to purchase a wide variety of pantry staples from dried whole grains and beans to nuts, seeds, and spices with minimal packaging. Items sold in bins without packaging offer one step fewer for the manufacturer, thus decreasing the overall cost of the goods.
In addition, bulk bins allow consumers to purchase only what’s needed at the time (eg, 1 cup or 1 teaspoon), which helps to avoid food waste and shaves money off each grocery bill. According to the Bulk is Green Council, buying foods in bulk can save customers an average of 89%.42 However, prices varied greatly depending on the item; bulk coffee and spices provided the most savings, while nuts and seeds provided the least.
Shop Locally and Seasonally
Other money-saving tactics include shopping locally and seasonally. Local foods are those that are grown or raised and harvested close to the place of purchase. Due to the short distance that these foods have to travel from farm to supermarket, consumers can benefit from higher-quality foods at a lower cost. The number of farmers’ markets nationwide has increased from 1,755 in 1994 to more than 8,000 in 2013 and continues to rise. When asked to rank the top three factors affecting what food and drink they purchased, 15% of people chose “locally produced,” stating that they felt local food offered a better value (good price for what you get), lower prices, and reliable products.43 Shopping according to the seasons when it comes to produce also can yield the best-tasting products at a low cost. Resources such as Sustainable Table,44 Eat Wild,45 Local Harvest,46 and the USDA Seasonal Produce Guide47 offer tools to help your clients find local and seasonal food in their areas.
Best Ways to Help Clients
Understanding the cost of healthful eating and the barriers that prevent consumers from making healthful choices at the supermarket can help dietitians educate clients on ways to save money while maintaining a nutritious diet. Recognizing efforts being made by food assistance programs, manufacturers, and delivery programs can help RDs reach consumers based on their current lifestyles. And acknowledging popular money-saving strategies both at home and in the supermarket aisles can help dietitians adapt their nutrition messaging to provide maximum impact when it comes to consumer purchasing behaviors on a budget.
— Amari Thomsen, MS, RD, LDN, is a Chicago-based freelance food and nutrition writer, former editor of Dietitians in Business and Communications newsletter, recipe developer, and author of Idiot’s Guides: Autoimmune Cookbook.
Learning Objectives
After completing this continuing education course, nutrition professionals should be better able to:
1. Discuss the significance of current food costs and how they influence consumers’ food choices.
2. Determine the myths associated with the cost of eating healthfully that affect consumer purchasing decisions.
3. Demonstrate a variety of ways to help consumers modify shopping behaviors to save money when purchasing healthful foods.
CPE Monthly Examination
1. According to a survey cited in this course, what percentage of Americans believe that grocery items are overpriced and should be cheaper?
a. 46%
b. 56%
c. 65%
d. 78%
2. Which of the following is one of the most important factors that affects the price of food?
a. Gasoline prices
b. Political influence
c. Increased demand for convenience foods
d. Length of growing season
3. Based on weight and cost per average portion, fruits and vegetables cost less than foods that should be consumed in moderation.
a. True
b. False
4. A food assistance program described in this course does which of the following?
a. It provides recipients with decreased program dollars.
b. It credits recipients who use program dollars on fresh produce.
c. It prevents recipients from using program dollars on processed foods.
d. It encourages recipients to use program dollars on meal delivery services.
5. Which of the following specialty diet trends is seeing an increase in demand by 10% annually?
a. Gluten-free
b. Vegan
c. Paleo
d. Sugar-free
6. Which of the following foods is in the top five on the Environmental Working Group’s Dirty Dozen list?
a. Cauliflower
b. Apples
c. Pineapple
d. Avocado
7. In January 2016, what was the average weekly cost of food spent by a family of four on the Thrifty Food Plan (the basis for the SNAP allotment)?
a. $89 to $108
b. $109 to $128
c. $131 to $152
d. $149 to $168
8. What is the main reason there are fewer opportunities to cook at home than there were in the 1960s?
a. Convenience and delivery/carry-out options are more readily available.
b. Time to cook is limited.
c. Food deserts are more common.
d. Today’s consumers don’t know how to cook.
9. Based on the 2015 study in the Journal of Nutrition Education and Behavior, consumers using a grocery list were more likely to do which of the following?
a. Spend less time at the supermarket
b. Navigate the grocery store more easily
c. Feel more organized
d. Have a lower BMI
10. How much less expensive are store-brand products as compared with their name-brand counterparts?
a. 5% to 10%
b. 15% to 20%
c. 25% to 30%
d. 35% to 40%
References
1. Healthy aspirations: the disconnect between Americans’ desire for a healthy lifestyle and actual behavior. Nielsen website. http://www.nielsen.com/us/en/insights/news/2014/healthy-aspirations-the-disconnect-between-americans-desire-for-a-healthy-lifestyle-and-actual-behavior.html. Published August 14, 2014. Accessed February 26, 2016.
2. Synovate survey finds majority of Americans shop with a grocery list. Market Research World website. http://www.marketresearchworld.net/content/view/2809/48/. Updated October 26, 2009. Accessed February 27, 2016.
3. Davidson P. Rising food prices pinching consumers. USA Today. April 16, 2014. http://www.usatoday.com/story/money/business/2014/04/16/cpi-shows-food-prices-rising/7742669/. Accessed February 20, 2016.
4. USDA Economic Research Service. Summary findings: food price outlook, 2016–17. http://www.ers.usda.gov/data-products/food-price-outlook/summary-findings.aspx#foodCPI. Updated September 23, 2016.
5. International Food Information Council Foundation. 2015 Food & Health Survey: what’s your health worth? http://www.foodinsight.org/sites/default/files/2015%20Food%20and%20Health%20Survey%20-%20FINAL.pdf. Published 2015.
6. Schnepf R, Congressional Research Service. Consumers and food price inflation. https://www.fas.org/sgp/crs/misc/R40545.pdf. Published September 13, 2013. Accessed February 26, 2016.
7. Carlson A, Frazão E, USDA Economic Research Service. Are healthy foods really more expensive? It depends on how you measure the price. http://www.ers.usda.gov/media/600474/eib96.pdf. Published May 2012. Accessed February 27, 2016.
8. USDA Food and Nutrition Service. Supplemental Nutrition Assistance Program (SNAP). http://www.fns.usda.gov/snap/supplemental-nutrition-assistance-program-snap. Updated August 11, 2016.
9. Black J. SNAP judgment. Slate website. http://www.slate.com/articles/business/moneybox/2013/08/food_stamp_choices_should_people_be_allowed_to_buy_junk_food_with_their.html. Updated August 6, 2013. Accessed February 28, 2016.
10. USDA Food and Nutrition Service. Evaluation of the Healthy Incentives Pilot (HIP): final report. http://www.fns.usda.gov/sites/default/files/HIP-Final.pdf. Published September 2014. Accessed February 28, 2016.
11. Get more fruits & vegetables with your SNAP Bridge Card at select grocery stores. Double Up Food Bucks website. http://www.doubleupfoodbucks.org/how-it-works/grocery-stores/. Updated August 2016.
12. Herrington D. Why is gluten free diet so expensive … and fattening? Real Food for Life website. http://realfoodforlife.com/why-is-a-gluten-free-diet-so-expensive-and-fattening/. Updated March 6, 2014. Accessed February 27, 2016.
13. Gluten-free products market by type (bakery products, pizzas & pastas, cereals & snacks, savories and others), source (oilseeds & pulses, rice & corn, dairy & meat products, and other crops), & by region — global trends & forecast to 2020. Markets and Markets website. http://www.marketsandmarkets.com/Market-Reports/gluten-free-products-market-738.html. Updated September 2015. Accessed February 28, 2016.
14. Ewoldt J. As organic goes mainstream, consumers can expect price breaks. StarTribune. May 11, 2014. http://www.startribune.com/as-organic-goes-mainstream-consumers-may-see-price-breaks/258720931/. Accessed June 14, 2016.
15. Faber S. Demand for organic food growing faster than domestic supply. Bay Journal. March 1, 2006. http://www.bayjournal.com/article/demand_for_organic_food_growing_faster_than_domestic_supply. Accessed February 27, 2016.
16. Executive summary: EWG’s 2016 Shoppers’ Guide to Pesticides in Produce. Environmental Working Group website. http://www.ewg.org/foodnews/summary.php. Updated 2016.
17. Ferdman RA. The slow death of the home-cooked meal. The Washington Post. March 5, 2015. https://www.washingtonpost.com/news/wonk/wp/2015/03/05/the-slow-death-of-the-home-cooked-meal/. Accessed February 28, 2016.
18. A coupon nation: Americans proudly use coupons more than shoppers in Great Britain, India and China, among others. PR Newswire website. http://www.prnewswire.com/news-releases/a-coupon-nation-americans-proudly-use-coupons-more-than-shoppers-in-great-britain-india-and-china-among-others-220485721.html. Published August 21, 2013. Accessed February 27, 2016.
19. Fowler G. Do online grocers beat supermarkets? The Wall Street Journal. January 7, 2014. http://www.wsj.com/articles/SB10001424052702304617404579304901729135002. Accessed February 27, 2016.
20. French S, Marmor Shaw J. Is this $2 billion meal startup really cheaper than Whole Foods? MarketWatch website. http://www.marketwatch.com/story/how-meal-delivery-can-make-whole-foods-look-cheap-2015-05-27. Published June 25, 2015. Accessed February 27, 2016.
21. USDA. Official USDA food plans: cost of food at home at four levels, U.S. Average, January 2016. http://www.cnpp.usda.gov/sites/default/files/CostofFoodJan2016_0.pdf. Published February 2016. Accessed June 14, 2016.
22. More Americans choosing foods, beverages based on healthfulness. International Food Information Council Foundation website. http://www.foodinsight.org/press-releases/more-americans-choosing-foods-beverages-based-healthfulness. Updated June 26, 2014. Accessed February 28, 2016.
23. Smith LP, Ng SW, Popkin BM. Trends in US home food preparation and consumption: analysis of national nutrition surveys and time use studies from 1965–1966 to 2007–2008. Nutr J. 2013;12:45.
24. Eating at home vs. eating out. 4 compelling reasons to cook your own meals. DailyHealthPost website. http://dailyhealthpost.com/eating-home-vs-eating-out-reasons-cook-own-meals/. Published August 21, 2014. Accessed February 28, 2016.
25. USDA Food and Nutrition Service. What’s cooking? USDA mixing bowl. http://www.whatscooking.fns.usda.gov/. Accessed February 27, 2016.
26. Dubowitz T, Cohen DA, Huang CY, Beckman RA, Collins RL. Using a grocery list is associated with a healthier diet and lower BMI among very high-risk adults. J Nutr Educ Behav. 2015;47(3):259-264.
27. Almy J, Wootan MG. The food industry’s sneaky strategy for selling more. Center for Science in the Public Interest website. https://cspinet.org/temptation-checkout. Published August 2015. Accessed October 28, 2016.
28. Forty percent of food in America is wasted. Ad Council website. http://savethefood.com/. Updated 2016.
29. Centers for Disease Control and Prevention. Do increased portion sizes affect how much we eat? http://www.cdc.gov/nccdphp/dnpa/nutrition/pdf/portion_size_research.pdf. Updated May 2006. Accessed February 26, 2016.
30. Hook DLB. How portion size adds up to obesity. Everyday Health website. http://www.everydayhealth.com/diet-nutrition/weight-management/big-food-are-we-eating-more.aspx. Updated August 5, 2009. Accessed February 27, 2016.
31. Portion distortion. USDA Choose MyPlate website. https://www.choosemyplate.gov/tools-portion-distortion. Updated October 12, 2016.
32. Portion size. MedlinePlus website. https://www.nlm.nih.gov/medlineplus/ency/patientinstructions/000337.htm. Updated October 28, 2014. Accessed February 27, 2016.
33. Ello-Martin JA, Ledikwe JH, Rolls BJ. The influence of food portion size and energy density on energy intake: implications for weight management. Am J Clin Nutr. 2005;82(1 Suppl):236S-241S.
34. Practical money skills for life: 2015 lunch spending survey. Practical Money Skills website. http://www.practicalmoneyskills.com/downloads/pdfs/Lunch_Spending_Survey_2015.pdf. Accessed February 27, 2016.
35. Touryalai H. Lunchtime: Americans spend nearly $1k annually eating out for lunch. Forbes. September 25, 2013. http://www.forbes.com/sites/halahtouryalai/2013/09/25/lunchtime-americans-spend-nearly-1k-annually-eating-out-for-lunch. Accessed February 27, 2016.
36. Kulp K. Buyers’ guide: how to buy in bulk. FOXBusiness website. http://www.foxbusiness.com/features/2012/04/17/buyers-guide-how-to-buy-in-bulk.html. Published April 17, 2012. Accessed February 27, 2016.
37. Understand the price tag. USDA Choose MyPlate website. http://www.choosemyplate.gov/budget-price-tag. Updated June 12, 2015. Accessed February 27, 2016.
38. Tuttle B. Brand names just don’t mean as much anymore. Time. November 1, 2012. http://business.time.com/2012/11/01/brand-names-just-dont-mean-as-much-anymore/. Accessed February 26, 2016.
39. Sethuraman R, Gielens K. Determinants of store brand share. J Retail. 2014;90(2):141-153.
40. Number of consumer packaged goods coupons redeemed throughout the United States from 2004 to 2013 (in billions). Statista website. https://www.statista.com/statistics/285775/cpg-coupons-redeemed-throughout-the-us-2004-2012/. Updated 2016. Accessed February 27, 2016.
41. Coupon statistics: general facts about coupons. I Love Coupon Month website. http://www.ilovecouponmonth.com/statistics/. Accessed February 27, 2016.
42. First-of-its kind U.S. study examines the economical and environmental benefits of buying bulk foods. Bulk is Green website. http://www.bulkisgreen.org/blog/?tag=/89%25+cost+savings+to+customers. Updated March 9, 2012. Accessed February 27, 2016.
43. Huber D. 13 new statistics about the local movement food business. Great Harvest Bread blog. https://blog.greatharvest.com/the-bread-business-blog/13-new-statistics-about-the-local-movement-for-food-businesses. Updated June 30, 2014. Accessed February 27, 2016.
44. Seasonal Food Guide. Sustainable Table website. http://www.sustainabletable.org/4529/sustainable-table-s-seasonal-food-guide. Updated 2016. Accessed February 28, 2016.
45. Eatwild’s Directory of U.S., Canadian and International Farms & Ranches. Eat Wild website. http://www.eatwild.com/products/. Updated 2015. Accessed February 28, 2016.
46. Local harvest. Local Harvest website. http://www.localharvest.org/. Updated 2016. Accessed February 28, 2016.
47. Seasonal Produce Guide. USDA SNAP-Ed Connection website. https://snaped.fns.usda.gov/nutrition-through-seasons/seasonal-produce. Updated October 21, 2016.